

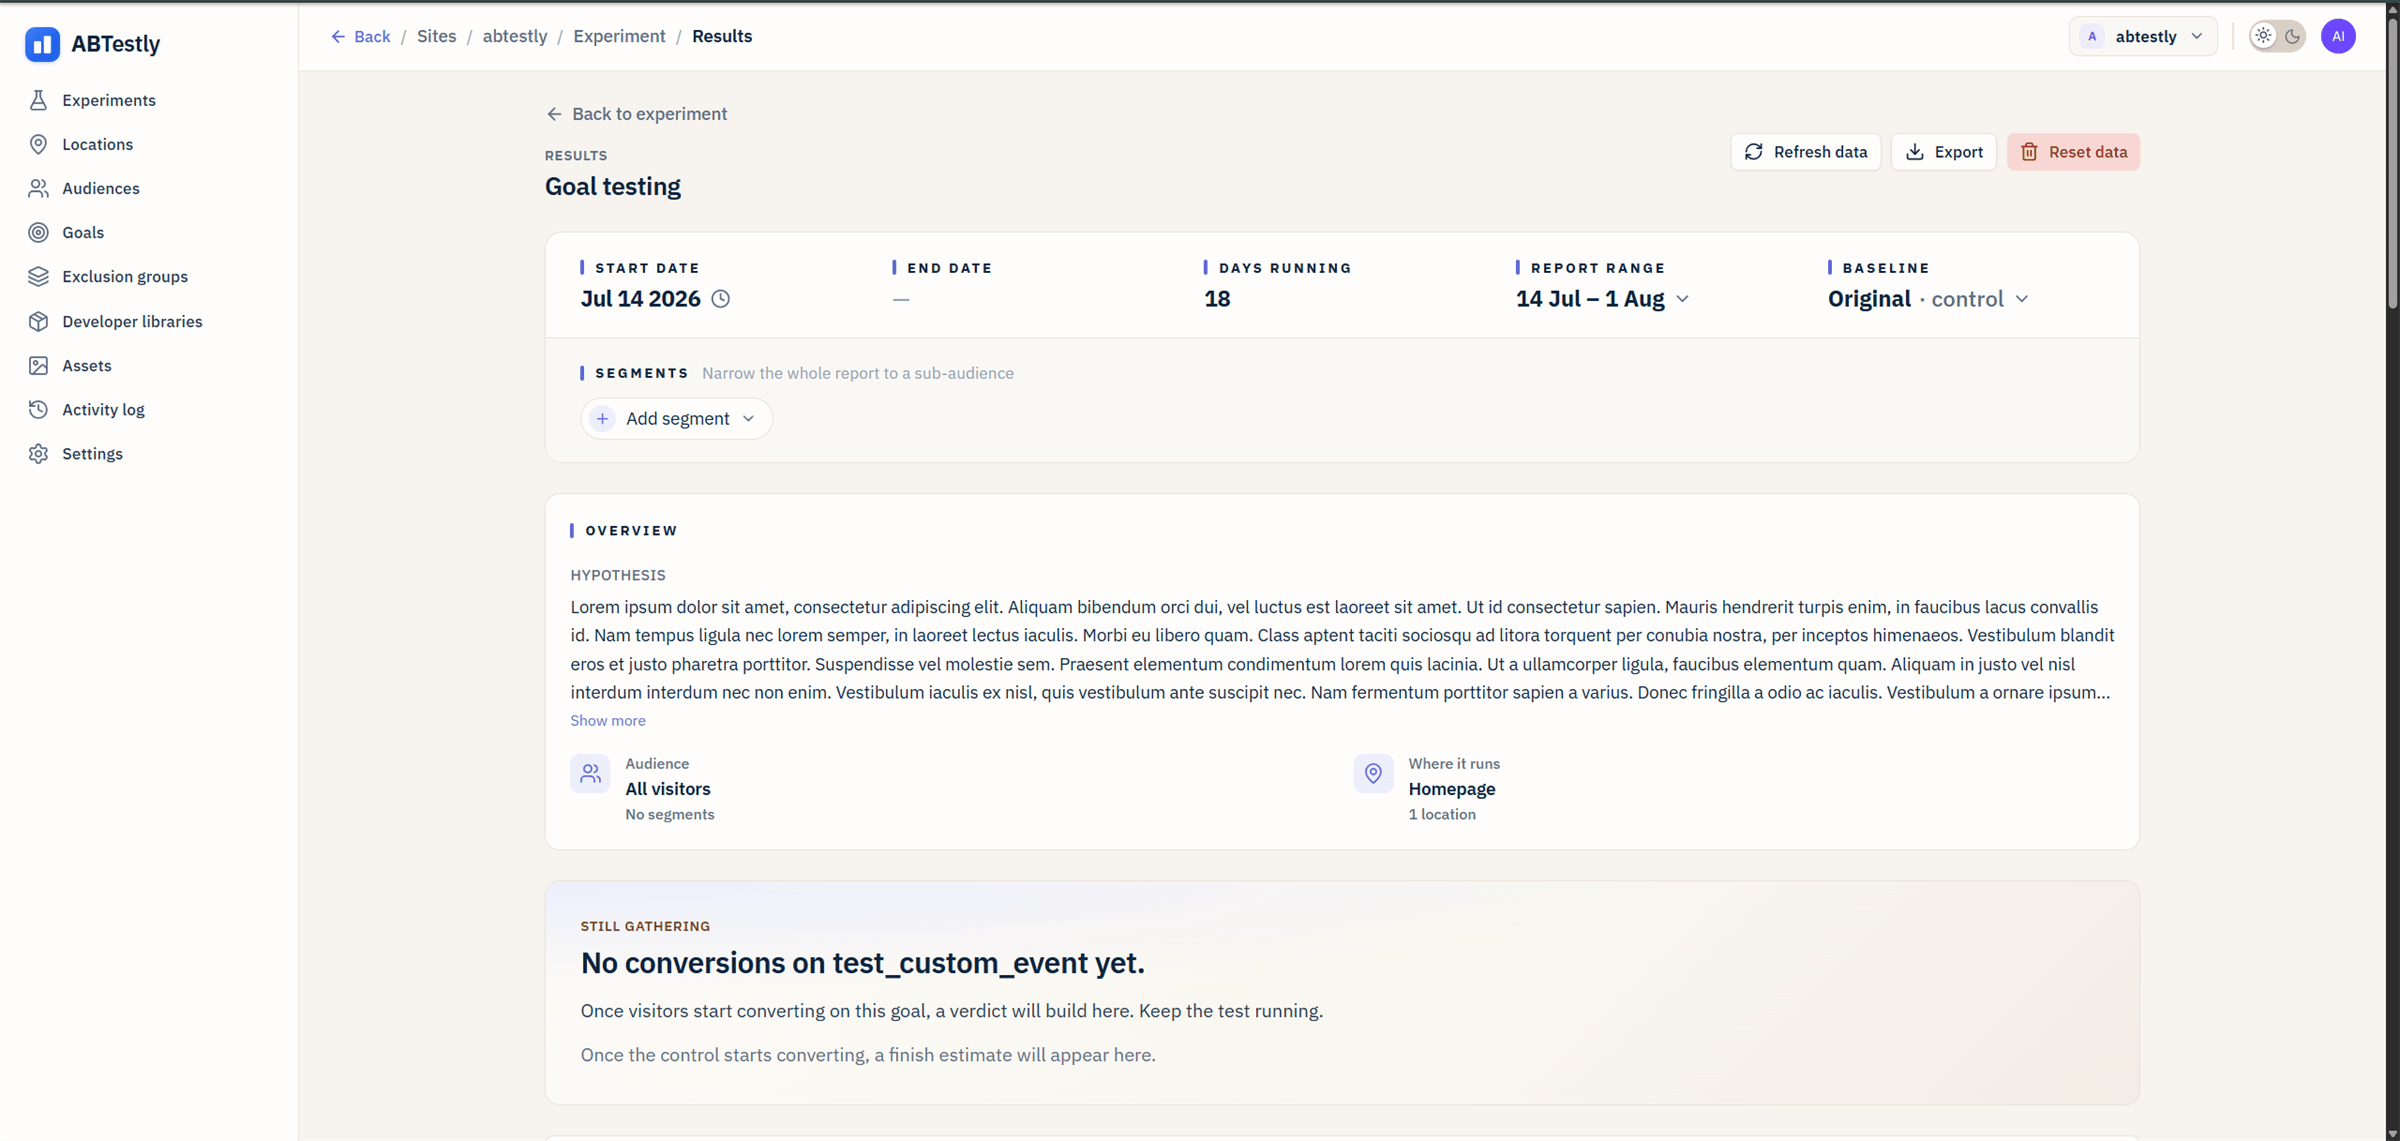
Results page while a test is still gathering.
Meta bar
Six things: start date, end date (blank while it is running), days running, report date range, baseline, and any active segments.- Report range defaults to the full running time. Change it to Last 7 or Last 14 to focus on recent traffic.
- Baseline is the variant every other variant is compared to. Defaults to the natural control (position 0). Override with the dropdown when you are comparing two treatments and neither is the “original”.
The verdict
Below meta, one heading. Written in plain English. It says one of:
The verdict is written by the engine you picked.
Frequentist, sequential, and Bayesian each phrase the same result slightly
differently, the shape of the sentence is the same.
Per-variant performance
Each variant gets a row. Visitors, conversions (or revenue), rate, and lift-vs-baseline with a confidence interval. The interval is what tells you whether the number is trustworthy.- Wide interval that crosses zero: no honest read yet. Keep collecting.
- Interval clears zero: an effect that direction. Read the verdict copy for whether it is large enough to call.
Confidence over time
A cumulative confidence chart plotted daily. It shows whether your test is converging (line trending toward a call) or wandering (line bouncing around zero). A test that has wandered for two weeks usually means the effect is not there.Segments
Below performance, a segment bar with an Add segment button. Slice the whole report by:- Device / browser / OS
- Country
- New vs returning
- Traffic source / entry path / UTM campaign
Segments narrow the whole report. When you filter to “Mobile”, the
verdict, per-variant rows, chart, and speed panel all recompute for
mobile visitors only. Sample sizes shrink accordingly, and the verdict
copy respects that.
Speed guardrail
If the site has speed data, a per-device panel shows p75 largest contentful paint for each variant, baseline first. This is a guardrail a variant that wins on your primary goal but tanks LCP on mobile is almost never worth shipping. The panel is quiet when it has nothing to say.SRM and completeness
Two banners can appear at the top of the page:- Sample ratio mismatch (SRM). The visitor split does not match the weights you set. Almost always a targeting or activation problem, not a statistics one. See SRM.
- Processing. The exact ledger is catching up on a burst of events. The dashboard’s live counters are current; the verdict is held while the ledger settles.
Exports
Top-right of the results page:- Refresh data, recomputes now.
- Export, CSV of the aggregated table, or an asynchronous raw-event export in CSV or JSONL. See Exports.
- Reset data, discards all data collected on this experiment and starts a new epoch. Used when you changed the variant meaningfully and want the numbers to reflect only the new version. Confirmation-gated.
When am I done?
There is no universal number. As a rough guide:- At least a few thousand visitors per variant. A hundred visitors on each arm cannot resolve a real 5 % lift.
- The verdict is a call, not a front-runner. “Front-runner” means “ahead, keep looking”.
- The confidence line has stopped moving fast. A line still climbing steeply means new data is still shifting the result.
- No red guardrails. A win with a broken guardrail is not a win.