

QA session links
A normal preview link carries a token scoped to one experiment. A QA session link carries a broader, site scoped token: it authorizes every draft and paused experiment on that site, so you can append another experiment’s pair to the URL by hand without going back to the dashboard for a new link.1
Open the preview modal
Go into the experiment and open Preview, then switch to the
QA Overlay tab.
2
Create the link
Click the action to create a QA session link. Nothing is minted until you
click, because this is the wider credential.
3
Copy it
The link is built from the variation currently selected, so it opens
something immediately. Copy it, or regenerate it if you need a fresh one.
What it is scoped to
- Every draft and paused experiment on that one site. It is not limited to the experiment you happened to open.
- 24 hours. After that the link stops working and you create another.
- Your registered domain, and
localhostonly if you tick that option before creating the link. The choice is baked into the token, so changing it means minting a new one.
Who can create one
The action appears only for users whose role grants QA session access on that site. The server enforces this on the mint request itself, so the hidden button is a convenience rather than the boundary. If you do not see the action, ask an admin about your role in Team and Access.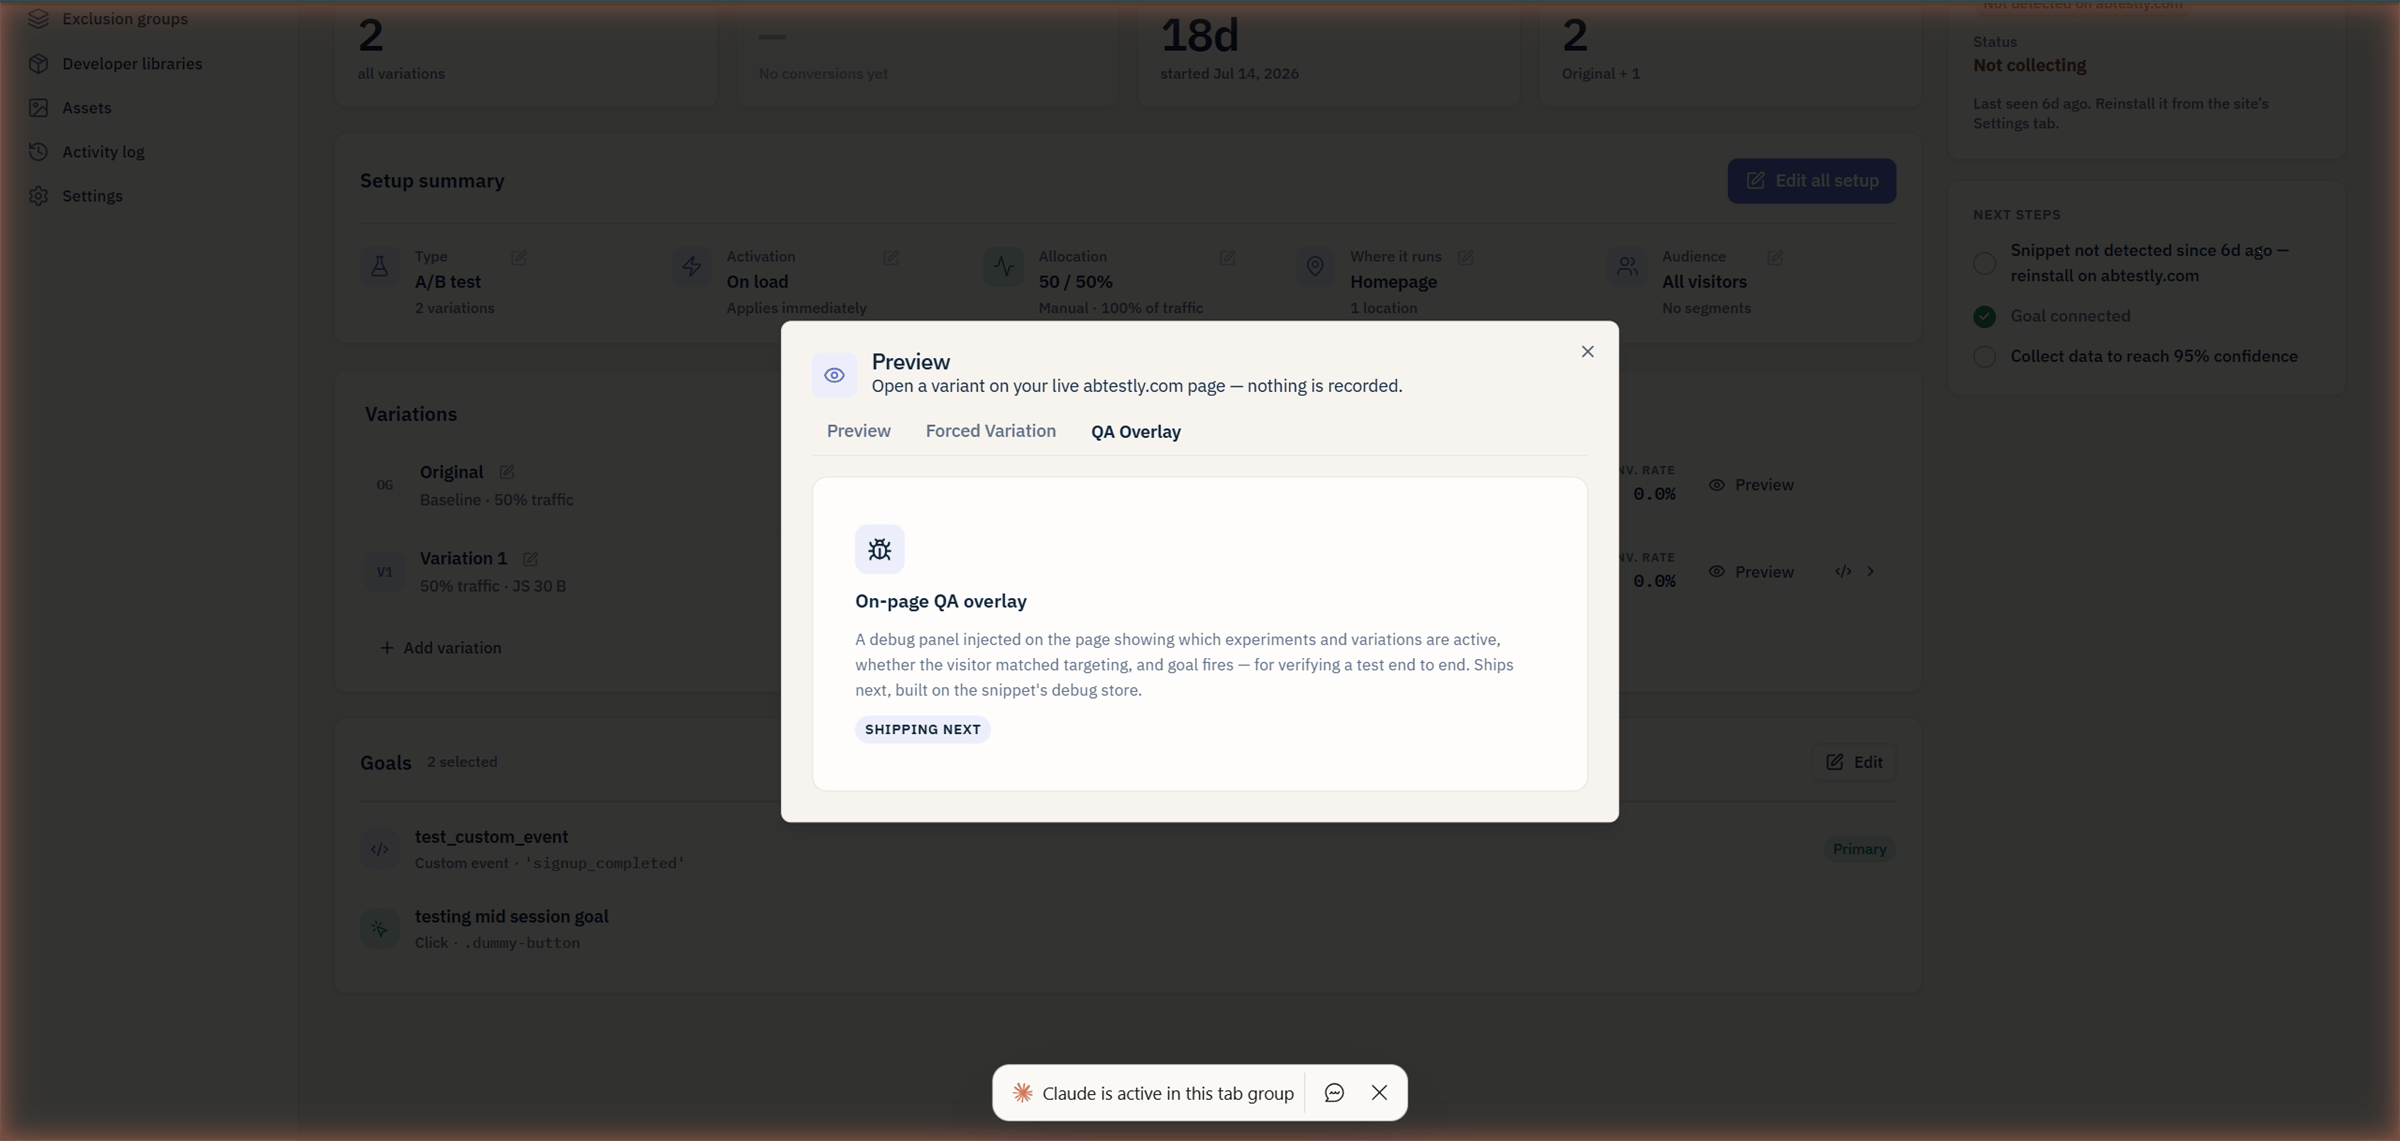
The overlay half of the QA Overlay tab today. The QA session link action appears above it for users whose role grants it.